Observability, incidents & safe rollouts
Core details
Problem this solves: know when users are harmed, find the responsible path quickly, mitigate before perfect root cause, and turn the lesson into a guardrail.
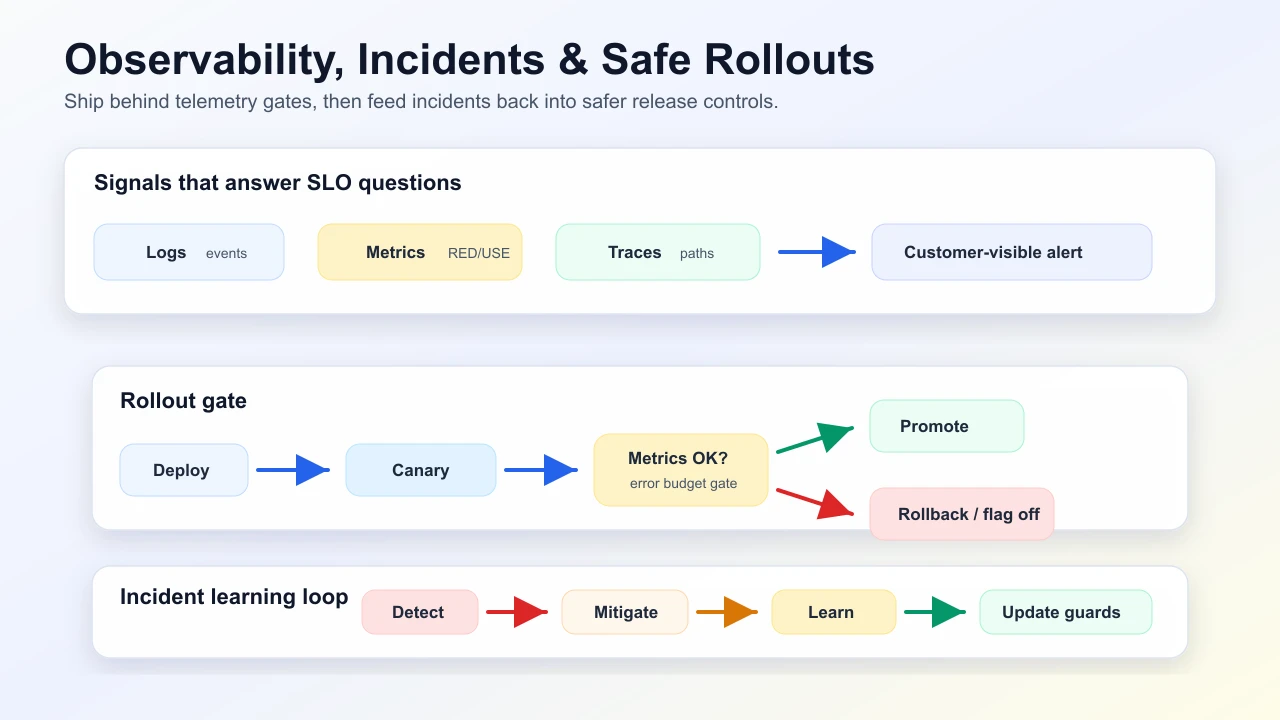
Three pillars: logs (events), metrics (aggregates), traces (request paths).
RED (service): rate, errors, duration. USE (resource): utilization, saturation, errors.
Structured logs + correlation id across services. Dashboards answer SLO questions—not vanity graphs.
Incident loop (spoken habit)
- Detect (alert routes to owner)
- Mitigate (rollback, feature flag off, scale, degrade)
- Fix root cause
- Postmortem with action items
Rollout strategies
| Strategy | Trade |
|---|---|
| Big bang | simple; high blast radius |
| Canary | small % traffic; needs metrics gate |
| Blue/green | instant switch; double capacity cost |
| Feature flags | off bad path without full redeploy |
Understanding
Alerts fire on customer-visible symptoms where possible—not only CPU. Runbooks reduce MTTR.
Observability is not a dashboard collection. It is a debugging contract:
- Metrics say that something is wrong.
- Traces say where time or errors entered the path.
- Logs say why one request or job made a decision.
- Deploy markers say what changed near the symptom.
- Runbooks say what to do now.
Safe rollout uses the same contract before full exposure. A canary should compare the new path against a stable baseline for the metrics that matter: error rate, latency, saturation, business success rate, and dependency pressure.
Senior understanding
Error budgets link reliability to feature velocity (Tail latency & SLOs). Chaos / game days validate assumptions.
| Probe | Strong answer |
|---|---|
| "What pages someone?" | SLO burn, customer-visible failures, and exhausted recovery budget |
| "High CPU alert?" | useful only if tied to saturation or user impact; otherwise route to dashboard, not pager |
| "Canary metric?" | compare new vs baseline for error rate, p95/p99, saturation, and core business conversion |
| "Postmortem quality?" | timeline, contributing factors, missed detection, action owners, and guardrail due dates |
Failure modes
- Alerting on host CPU while checkout errors go unnoticed.
- Logs lack request/user/tenant/correlation identifiers, so incidents become search exercises.
- Traces sample away the exact error path during low-volume but high-impact failures.
- Canary watches only infrastructure health and misses business regressions.
- Postmortems assign blame instead of changing tests, dashboards, rollout gates, or ownership.
Interview drill
Question: "A canary deploy increases p99 latency but error rate is flat. What do you do?"
Model answer structure:
- Stop or hold the canary; do not promote while the named SLO is regressing.
- Compare traces between baseline and canary for dependency latency, pool waits, retries, payload size, and CPU time.
- Check saturation metrics: event loop lag, connection pool wait, queue depth, memory/GC, throttling.
- Decide mitigation: rollback, feature flag off, reduce traffic, or apply safe config change.
- Add a rollout gate for the discovered leading indicator.
Follow-ups to expect:
- "What if p99 only regresses for one tenant?"
- "When do you page versus create a ticket?"
- "How do you handle an incident with no clear owner?"
Diagram
See also
Mark this page when you finish learning it.
Last updated on
Spotted something unclear or wrong on this page?